The Triple Exponential Indicator (TRIX) applies three sequential exponential moving averages to price series and computes the one-period percentage rate of change. It acts as a momentum oscillator centered around zero, filtering out insignificant price noise. TRIX is used for trend confirmation, divergence analysis, and signal generation in systematic trading.
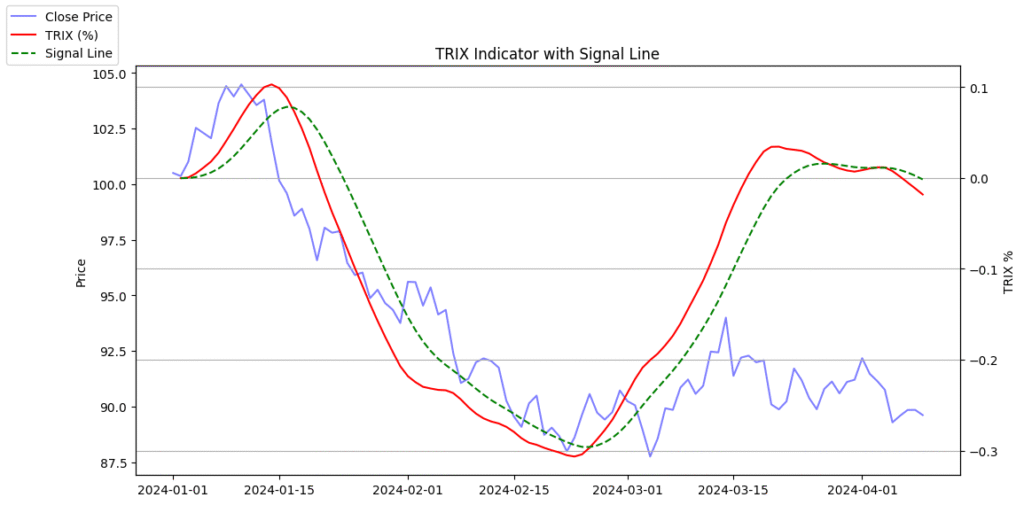
A single-line TRIX is the smoothed, single-output line that results after triple-exponential smoothing and calculating the one-period rate of change.
When interpreting it:
- Above zero and rising → bullish momentum is strengthening.
- Above zero but falling → uptrend is weakening (potential reversal or correction).
- Below zero and falling → bearish momentum is strengthening.
- Below zero but rising → downtrend is weakening (possible bottom forming).
- Zero crossovers (crossing from below to above zero or vice versa) are classic buy/sell signals.
Key point:
The single TRIX line alone reflects both trend direction and momentum strength.
However, because it is triple-smoothed, it reacts slower than typical oscillators like RSI or MACD, reducing false signals but at the cost of later entries